Lab 3: Clouds and Drawings
Overview
Besides bar graphs and scatter plots, there have been many alternate creative methods
for visualizing the statistical properties of a document. There is also a certain
creativity to the display of text through the individual glyph descriptions of
a font. In this lab, we’ll explore two visualization techniques and explore the
process of creating a font.
Creating a Font
Follow the instructions at Calligraphr
about how to create a free font using their software. The font you create can be your
own handwriting, or any other artistic interpretation of the standard English
and numerical characters.
In step 8 of the tutorial, you should inspect your font and select on individual
characters to edit and standardize your font. Try to make sure the bottom of the characters
is at the baseline, the
top of the capital letters is near the cap height,
and the lower case letters are near the x-height line.
Write a description of your font, discussing it in terms of the common
typeface categories
of Serif, Sans-Serif, Script, Monospaced, and Display.
Note: If your font does not follow
the standard above about the baseline, x-height, and cap-height, justify your creative choices.
Install this font on your computer, and use a Word Processing software to
format your Poem in this font. (Google Docs cannot import new fonts.)
Export a PDF of this document for submission.
Word Clouds
Use the code discussed in class to create a Word Cloud for your
Book, using the font you created above.
To get this to work, you will most likely have to delete and reset the
font cache from matplotlib.
Warning: This took me a while to get right, please stop by for help when you need it.
Adding color
Use the english2.txt word list to change the color of the words in
the cloud, where words that are not found in English are shown in
Red, while those in English are shown in Black.
Adding rotation
The text of some elements in a Word Cloud is often rotated 90 degrees.
Investigate Text Rotation
in matplotlib and incorporate it into your Word Cloud, so that each word
has a 50% chance of being displayed vertically.
Sentence Drawing
A Sentence Drawing can
be constructed from a document to visualize the flow and rhythm of the
text. Implement the following algorithm and create a diagram for your
document.
- Start at point 0,0, pointing north
- For each sentence in your document
- Draw a line forward where the length is the number of words in
the sentence
- Turn right 90 degrees
Note: If your document is very large, only draw this image for the first
section/chapter.
If you record your x and y values in two lists, called xs and ys,
the following code can be used to the create the diagram.
import pandas as pd
from plotnine import *

drawing = pd.DataFrame({"x":xs, "y":ys, "time":range(len(xs))})
ggplot(drawing, aes(x = "x", y = "y")) + \
geom_path(aes(color="time")) + theme_void() + \
theme(aspect_ratio=1)
You should see an image like this:
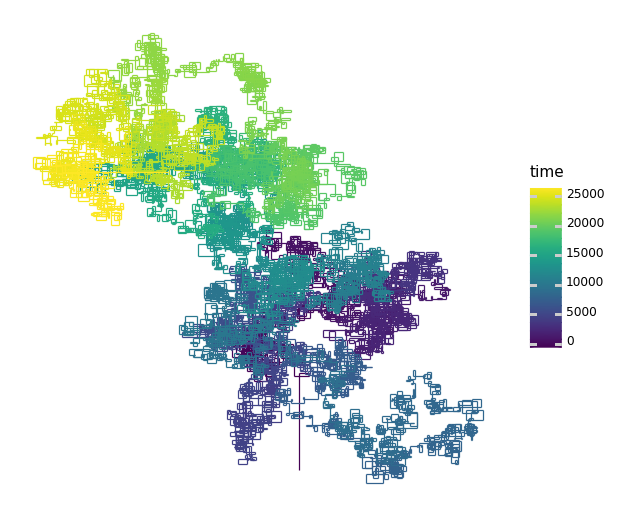
What insights on your document can you gather from this image?
What to Hand In
Turn in your PDF and .ipynb file to the Lab 3 directory on Moodle.